One of the biggest areas of improvement needed in construction is data sophistication. With the rise of analytics tools, there has never been a better time to introduce analytics in your organization.

It's no secret that construction has faced a seemingly never-ending productivity crisis, with the productivity growth rate stuck at around 1% for far too long now. Compared to other economic sectors, this number lags far behind and needs some serious attention.
One of the biggest reasons why construction has struggled to improve productivity is because companies are simply not equipped to understand how they can improve. How did this happen? Simple - it all comes down to tools.
Just like you need the right tools to build things on-site, you need the right digital tools to see things clearly across the organization.
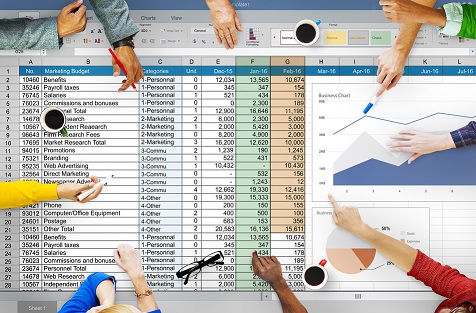
A lot of contractors today still rely on spreadsheets as a tool to organize and capture project data in a digital format. This reliance on the spreadsheet is one of the big culprits behind the industry's struggle.
Time to be frank: spreadsheets are holding the industry back. We need to stop using them immediately!
So what's wrong with the spreadsheet? So so much... Here are 3 quick reasons why spreadsheets need to go:
1. Manual data entry
None of the data captured inside a spreadsheet is produced in real-time but is entered manually instead. As a result, you're always looking at a data snapshot that lags behind the real world. To put into perspective how crazy manual entry is: imagine trying to watch your favourite sports team play but, instead of watching them play live, you're watching the game a couple of days or even a week after it happened. Brutal!
2. Data silos
Unless you're a spreadsheet macro guru, there's a good chance your spreadsheets are housing data in their own little silos. This makes it extremely challenging to ever compare datasets at a higher business level. Good luck stitching everything together!
3. Terrible user experience
Let's be honest, does anyone ever really enjoy working in a spreadsheet? Why are we forcing ourselves to use the ugliest digital tool imaginable? Yuck, spreadsheets make me depressed just thinking about them. Instead, let's use much better, well-designed, and modern mobile-friendly tools to update and track data across the field and the office.
Trust me, I could spend all day talking about how spreadsheets hold us back. But I digress.
Let's switch to the better tool that we should all be using: analytics.
So how can analytics help you? Among the many benefits, analytics can help you:
-
Compile much more accurate project bids
-
Forecast project issues and risks far in advance
-
Predict project outcomes
-
Optimize processes
-
Budget and plan accurately
If you need more convincing, a simple google search on the benefits of analytics in construction will give you a plethora of reasons why you need to get moving today.
So rather than continuing to walk you through how analytics can help you, I want to give you 3 actionable steps you can take to start rolling out analytics across your organization today:
Step 1: Digitize Your Data

The very first step to your new analytics strategy is to take stock of all the data you currently have. Think about exactly how much data you currently have across all your different mediums, from paper to spreadsheets to accounting software. The truth is that most companies have way more data than they think, which presents good and bad news.
First, the bad news:
Your data is likely to be distributed across many different files and mediums, with some data potentially being stored on paper only. This does indeed mean that the task of gathering all your existing data can be rather tedious and time-consuming. However, your effort to gather all your current data on past projects does not have to be a fully manual one. Luckily, the rise of CWA automation tools has made the process of data aggregation much easier.
Now on to the good news:
Having a large amount of data gets you off to an amazing starting point in terms of analytics. Generally-speaking, the more data you have, the more effective your insights from analytics can be. In order for you to maximize the value out of an analytics strategy, you need to consistently feed the analytics tool data so that it can present you with more and more correlations.

Some more good news here is that this arduous process of digitizing your entire dataset is a one-time process. Once you digitize all of it, the rest of your data will be produced using modern software platforms moving forward.
Now it's time to pick your engine.
Step 2: Choose Your Analytics Engine

The main question here is: how do you know what to look for when selecting an analytics tool?
There are two main routes you can take here:
1. Deploy an existing construction management software tool that includes built-in analytics.
Pros:
-
Gives you a multi-purpose tool to use for the rest of your project management processes as well as for analytics
-
Most tools include mobile apps for field teams to use
Cons:
-
The primary input method is still manual data entry
-
Built-in analytics are very limited
-
Few customization options for analytics
2. Deploy a fully-featured analytics platform and use integrations to feed the data into the tool.
Pros:
-
No limitations on analytics capabilities
-
Full customization options
-
You have much more control over how you want to present your data
-
Integrations give you much more flexibility in terms of the rest of the tools you want to use throughout your business, enabling you to deploy next-gen automation software
Cons:
-
Need to manage multiple tools
-
Need to integrate the other tools into the analytics tool
My personal recommendation is to go with option #2. Yes, you will need to deploy an analytics tool plus one or more other tools for the rest of your business. But in my experience, the existing construction management tools in option #1 are still too inefficient to use due to the fact that you're still operating in the world of manual entry.
By going with the integration route in option #2, you can choose from much more advanced software tools like CWA and simply integrate it together with your analytics platform. You'll just have way more freedom of choice with option #2, as opposed to entertaining a sub-par and more limiting data analytics experience with option #1.
Just make sure that the analytics tool you choose has the highest degree of integration support, giving you the most flexibility moving forward.
Here are some examples of tools you can deploy using option #2:
Analytics: Tableau, Qlik, Microsoft Power BI
Automated construction workflow management: OnTraccr, Zapier
So now that you've digitized all your current data and selected your analytics engine, there's still one major step left in your analytics strategy.
Step 3: Change the Company Culture

Every strategy ultimately lives and dies by the people carrying it out. If the people don't fully buy into it, you will fail. Period.
This is why it is absolutely imperative that you do not overlook the culture change analytics will introduce in your organization. Your company's culture matters just as much as the tool you use, if not more.
You need to put a system in place where your entire organization, not just management, shifts to becoming a data-driven organization. This really starts from the field.
In order for your dataset to be as clean and useful as possible, you need your field team to understand exactly why data matters so much. Start by educating them on the need to produce and document project data as accurately and timely as possible.
Your project management and leadership teams will also need to understand the importance of data. Help them understand the purpose of these new tools and why your business needs them in order to compete and grow.
Once again, do not underestimate the role of culture in your analytics strategy.
If you don't take the time to train your entire business, this entire project will have been a massive waste of resources.
Final Thoughts
Analytics will play a huge role in construction for many years to come. The companies that embrace this level of data sophistication will ultimately remain competitive and succeed moving forward. Those that continue to ignore the power of this technology, will pay the price.
To roll out analytics within your organization, you need to completely digitize your current data, select your analytics tool, and change your company culture.
Once you complete these three steps, you will chart a new path that will take your organization to a new level and completely change the way you operate.
If you enjoyed this article, join our mailing list now to receive all the latest articles and stay up-to-date on what OnTraccr is developing to automate the construction industry!